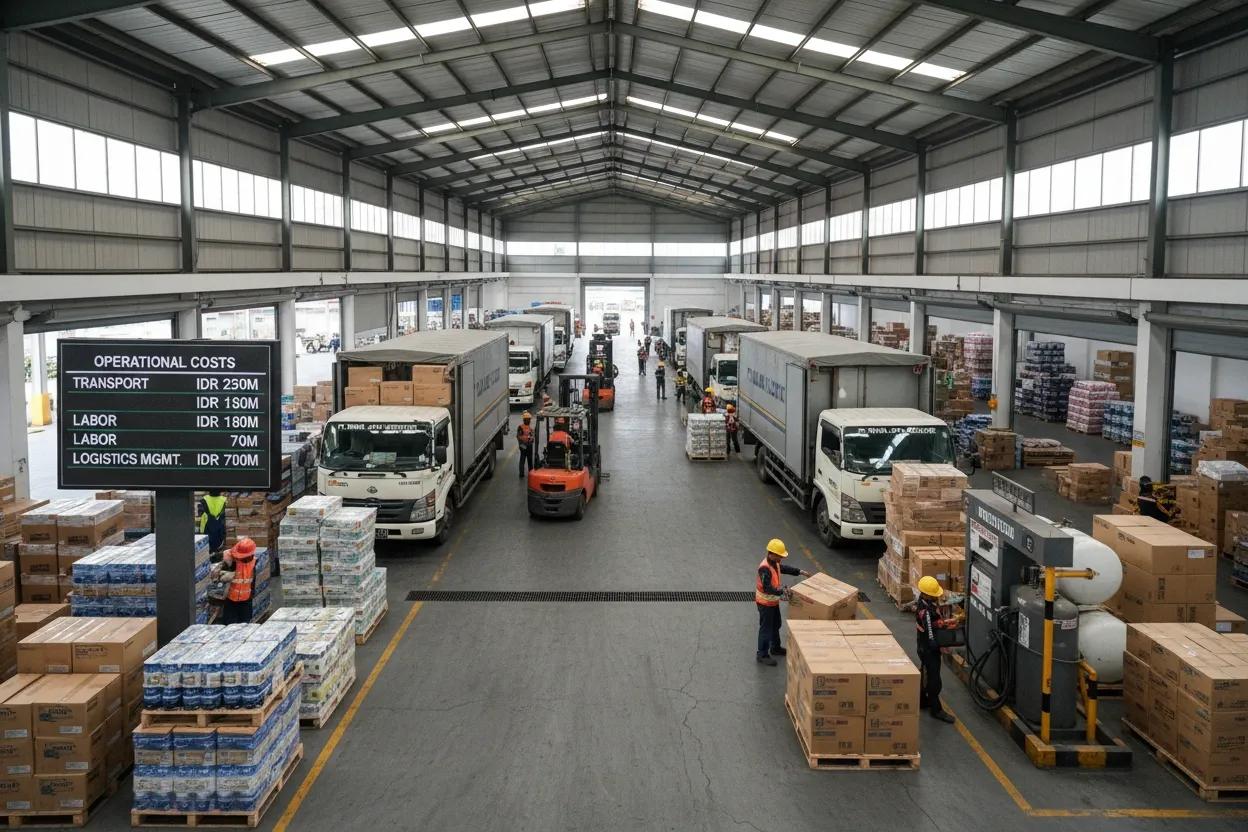
Warehouse performance has a direct impact on how well inventory and orders are handled within a distribution operation. When warehouse performance is not reviewed regularly, issues may remain unnoticed and operational results may fall below the targets set by the company.
For distributors handling high volumes of inventory and orders, relying on general observations alone does not provide enough information to assess warehouse performance. A clear set of measurements is needed to show how the warehouse is performing against its targets.
Why Should Distributors Track Warehouse KPIs?
Warehouse KPIs give distributors measurable indicators to evaluate how inventory moves through different warehouse activities. The metrics can be applied across receiving, storage, inventory handling, picking, packing, and outbound processes, allowing warehouse teams to assess performance at each stage.
Tracking warehouse KPIs also helps distributors measure areas such as inventory accuracy, staff productivity, storage utilization, and operating costs. Regularly reviewing these metrics helps identify areas that require attention, measure operational results, and monitor the resources used across warehouse activities.
Warehouse KPI Examples Distributors Should Track
Different warehouse activities require different measurements. Distributors can use warehouse KPIs to assess inventory accuracy, order fulfillment, and other operational areas. Below are examples of KPIs every distributor should track:
- Inventory Accuracy
Inventory Accuracy measures how closely the stock recorded in the system matches the quantity physically available in the warehouse. A high accuracy rate indicates that inventory records closely reflect actual stock levels, while a lower result may increase the risk of stock discrepancies, picking errors, or purchasing decisions based on incorrect inventory data.
For example, a warehouse system records 20,000 units, while a physical stock count confirms 18,950 units. Inventory accuracy can be calculated as:
18,950 ÷ 20,000 × 100% = 94.75% - Order Fulfillment Rate
Order Fulfillment Rate measures the percentage of orders that are completed in full within a specific period. The KPI provides an indication of how effectively the warehouse handles customer orders based on available stock and operational capacity.
A low fulfillment rate may indicate issues related to inventory availability, picking activities, workforce capacity, or outbound operations.
For example, if a distributor receives 2,000 orders in one month and 1,900 are fulfilled in full, the Order Fulfillment Rate is:
1,900 ÷ 2,000 × 100% = 95% - Dock-to-Stock Time
Dock-to-Stock Time is the duration between a shipment arriving at the receiving area and the inventory becoming available in its assigned storage location or inventory system. A shorter duration means newly received products become available for warehouse operations sooner.
Distributors can use this KPI to identify delays within receiving and putaway activities. For example, if goods arrive at the receiving area at 07:00 and are placed in their assigned storage location at 11:00, the Dock-to-Stock Time is:
11:00 - 07:00 = 4 hours - Picking Accuracy
Picking Accuracy indicates how often warehouse staff select the correct items based on customer orders. The metric can be reviewed alongside factors like picking instructions, warehouse layout, barcode scanning, and staff performance.
Low picking accuracy can lead to incorrect shipments, product returns, additional handling costs, and customer complaints. Tracking the KPI helps distributors see whether changes are needed across the picking process. - Receiving Accuracy
Receiving Accuracy measures the percentage of incoming goods that match the purchase order or receiving document in terms of product type, quantity, and other relevant attributes. The KPI gives distributors an indication of how accurately goods are checked when they enter the warehouse.
For example, if 500 units are received and 485 units match the order details, the Receiving Accuracy is:
485 ÷ 500 × 100% = 97% - Order Cycle Time
Order Cycle Time refers to the duration from the moment an order is received until the order has completed the required processing stages. Rather than focusing on a single warehouse activity, the KPI provides a view of how long an order takes to move through the fulfillment process.
Distributors can review the time spent at each stage to identify where delays occur. If one stage takes significantly longer than others, the finding can help determine which part of the process should receive attention first. - On-Time Shipment Rate
On-Time Shipment Rate measures the percentage of shipments dispatched according to the scheduled delivery time. The KPI indicates whether warehouse operations can prepare and release orders according to the required shipment schedule. - Inventory Turnover
Inventory Turnover shows how frequently inventory is sold or replaced within a specific period. The metric gives distributors a view of how quickly products move through the warehouse and whether certain items remain in storage for an extended period.
For example, if a distributor has an average inventory value of $100,000 and records $600,000 in cost of goods sold during one year, the Inventory Turnover is:
$600,000 ÷ $100,000 = 6 times
A turnover rate of 6 times means the average inventory is sold or replaced approximately six times within the year. A lower rate may indicate overstock or slow-moving inventory that requires further review. - Shrinkage Rate
Shrinkage Rate represents the percentage of inventory that is lost, damaged, or cannot be accounted for relative to the total inventory recorded. The KPI provides an indication of how much stock is affected by inventory loss within a given period.
For example, if a warehouse records 50,000 units in inventory and 250 units are identified as lost, damaged, or unaccounted for, the Shrinkage Rate is:
250 ÷ 50,000 × 100% = 0.5% - Warehouse Capacity Utilization
Warehouse Capacity Utilization measures how much of the available warehouse space is being occupied by inventory.
For example, a distributor has 2,000 pallet locations across its warehouse, with 1,600 locations currently occupied. The Warehouse Capacity Utilization is:
1,600 ÷ 2,000 × 100% = 80%
Track and Improve Warehouse Performance with BOSNET Warehouse Management Software (WMS)
BOSNET Warehouse Management System helps businesses manage stock across the warehouse. By automating inventory processes and providing real-time visibility, businesses can identify products faster, track stock movement accurately, and maintain records across multiple warehouse locations.
With its self-correcting system, BOSNET Warehouse Management System automatically updates inventory records based on the latest physical activity, delivering precise data for smarter decision-making and helping FMCG businesses increase revenue and reduce costs.
Contact us to see how BOSNET can efficiently manage your warehouse.
#BOSNET #BestFMCGRunsBOSNET #Distribution #SupplyChain #IncreaseRevenue #ReduceCost